The View from the Hill - Perspectives on Markets and Strategies

The link between risk levels and time horizon is an important one for equity investors that often does not get the respect it deserves. For example, in a normal (15%) volatility regime, the chance of a 10% decline in a three-month period for the S&P 500 is just 7% compared to a much higher level of 23% in a high (30%) volatility regime. Also consider the fact that in both a normal and high volatility regime, the chance of a 10% decline in three months is about the same as the chance of 20% decline in a year. We take a look at this volatility/time horizon connection that can be critical to constructing downside-risk strategies based on a specific investment outlook.
The year 2020 will go down in the history books for recording the worst global pandemic in the last 100 years, but it will also be remembered for the related chaos inflicted on financial markets. Equity values have rebounded in the last few months and investors large and small are finding themselves with high equity exposure despite a still dire economic outlook. But we are still in a volatility regime that is well above normal, at least based on the volatility statistics through July 2020 compared to the prior 10- and 20-year periods.
S&P 500 Volatility
Annualized Based on Monthly Returns

Source: S&P Dow Jones Indexes
*YTD through 7/30/2020
S&P 500 Volatility by Month in 2020
Based on Daily Returns, Annualized

Source: S&P Dow Jones Indexes.
Yes, U.S. equity markets in July were calmer, with volatility at only 13.2% annualized. But annualized volatility based on monthly returns through July was as high as 30%. The volatility metric for daily returns is even higher at over 40%. Given that the economic fallout from the pandemic has yet to be fully felt, along with the political instability of an election year, it is hard to see the high volatility regime changing dramatically in the months to come. Therefore, it makes sense to take a look at what both normal and high volatility for the S&P 500 means in terms of downside risk for investors with different investment horizons.
Mapping Expected Risk into Downside Buffer Strategies for a Specific Horizon
Investors have a number of choices now across strategies that offer ranges of protection (buffers) for downside moves. Target/defined outcome buffer products come in a variety of wrappers (ETF, mutual fund, UIT), outcome periods (e.g., 12, 15, 18, 24 months) and protection levels (e.g., 0 to -10%, -5 to -30%, etc.). Point-to-point strategies are offered in ETFs and a diversified laddered blend of strategies, launched as a mutual fund in 2016 by Cboe Vest, is now available in ETFs, as well. Therefore, investors can choose to protect different ranges of downside for different time periods.
Probability of S&P 500 Returns < Specified Level
Assuming Annual Expected Returns of 5%
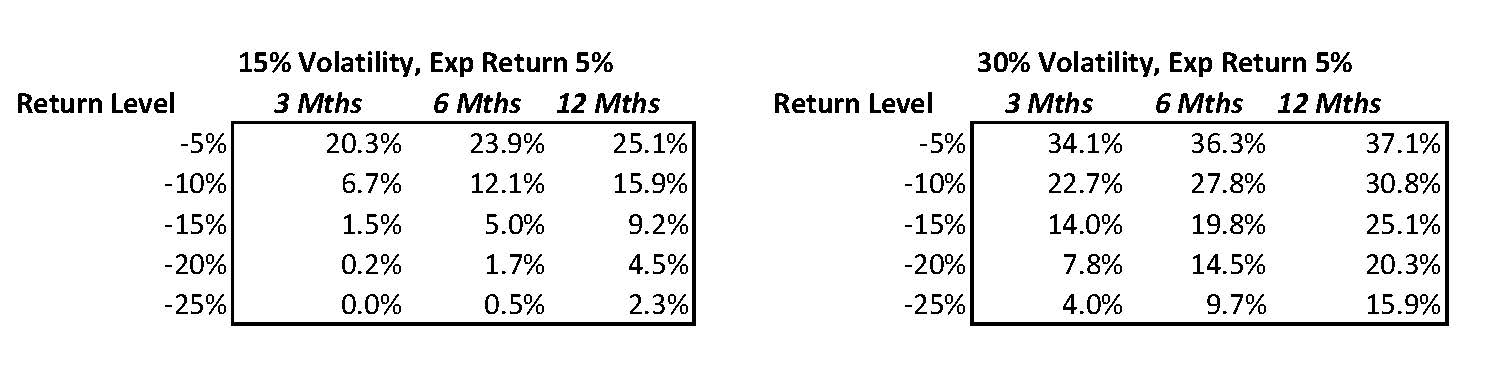
Source: Cboe Vest based on a normal probability distribution with a mean of 5% and standard deviation of 15% or 30%.
The table above shows the chance of returns for the S&P 500 below a threshold level for three, six and 12-month horizons for a normal and a high volatility regime. To produce these measures, we assumed an expected return of 5% annually for the S&P 500 and calculated the chances based on a normal distribution centered around this expected return with either a 15% or 30% standard deviation. We used 15% as representative of a normal volatility level based on risk experience over the 2000-2019 period and 30% for the high volatility regime, which is approximately the volatility for 2020 through the end of July based on monthly returns (the volatility based on daily returns.
Most investors are aware that the chance of a 10% decline in the S&P 500 is much higher out six months than in one month, and certainly it is not unusual at all over the course of a year. But how much more likely? And how is this affected by the level of risk/volatility inherent in the market?
A few key observations from the analysis highlighted in the table stand out:
- The chance of a steep decline for the S&P 500 is much larger in a high volatility regime.For example, in a six-month time frame, the chance of having an S&P 500 return below -10% is only 12% in a normal volatility environment but goes up to 28% in a high volatility regime.
- The chance of a decline does not fall as fast as you might think for shorter investment horizons. For example, a -10% downside move over the course of a full year has a probability of 16% in a normal volatility regime, but it is still as much as 12% likely in a six-month time frame. When we are in a high volatility regime, the chance of a -10% or worse decline goes up from 16% to 31% for a 12-month horizon and from 12% to 28% for a six-month horizon.
- Even for short investment horizons such as three months, there is a chance of a decline of -5% or more in one period out of four (23%) in a high volatility regime. This compares to only a 7% chance in a normal volatility regime.
- When high volatility sticks around for a while, downside risk is quite high. Over a 12-month period there is a 30% chance of a return of -10% or worse in a high volatility regime.
Implications for Downside-Risk Strategy Design
What does this mean for investors looking to put downside risk strategies in place for the next three, six or 12 months? A view on the volatility regime over your investment horizon is critical to selection of a downside protection range for risk management. Over the next six months at least, there are two factors that point to the environment being closer to a high volatility regime than a normal volatility regime.
First, the fall months of the calendar year tend to be seasonally the most volatile months, and this can extend into the first quarter of the next year, as well. In addition, this year is a Presidential election year, so the seasonal effect tends to be even stronger, based on statistics from VIX levels back to 1990. Expectations of volatility for November and December as priced into October and November VIX futures have been trading at levels over 30% recently, confirming that market participants believe high volatility will continue.
Volatility by Calendar Month: Presidential Election Years vs. Other Years
Based on Average Closing VIX Levels, 1990-2019

Source: Bloomberg and Cboe.
Second, 2020 has been an extraordinarily volatile year already for U.S. equities. Annualized volatility through the end of July was over 40%. Although the S&P 500 in July managed to deliver risk metrics below the 18.8% 20-year average through 2019, five of the seven calendar months had volatility well above this average. There remains much uncertainty about the speed of the economic recovery, and equity gains have been fast and furious over the last few months. These large moves to both the upside and downside suggest we are still likely to encounter U.S. equity markets with volatility well above normal, as the outlook shifts and flows influence short-term price moves.
On any given date, ETFs are available that have buffer protection strategies with different time frames designated by the month in their ticker. Also, there is a choice of a downside buffer range covering 10% or wider ranges of 15% to 25%. Therefore, investors can customize their downside-risk strategy to their investment horizon. This analysis suggests that investors who are moderately bullish but have a downside protection horizon of three months or less would be best served utilizing strategies that have buffer ranges from 0 to -10% for part or all of their exposure. There is still as much as a 20% chance of a worse than -10% decline but most of the downside outcomes for this short horizon would likely be covered. For horizons of six months or longer, investors who are looking for the protection range to cover the most likely outcomes should use deeper protection ranges that protect 20% or more downside. The chance of a decline worse than -20% is approximately 15% for a six-month horizon and one in five (20%) over 12 months in a high volatility regime.